
It was pissing me off how hard it is to plot decent Molecular Electrostatic Potentials using ORCA and that’s why I’m posting this (so you too don’t have to be pissed off).
First of all, ORCA does have a utility to plot MEPS for you, it is called orca_vpot. It is nicely described in chapter 9.46.10 of the ORCA 5.0.3 manual and in the ORCA Input Library. The command to get the potentials is not difficult: you need the gbw (orca always gives you this), the scfp densities (you may request it to be kept with ! KeepDens), the surfaces to which the potentials will be mapped to (vpot.xyz) and the output vpot.out.
orca_vpot filename.gbw filename.scfp filename.vpot.xyz filename.vpot.outThe gbw, scfp and out files are straightforward; but the surface (vpot.xyz) is complicated to get. Luckily there is a python script to help with that part, provided by Marius Retegan here. I’m preserving the script below but go and say thank you to Marius for his work.
"""
(c) 2013, 2019 Marius Retegan

License: BSD-2-Clause

Description: Create a .cube file of the moleclar electrostatic
             potential (MEP) using ORCA.

Run: python mep.py basename npoints (e.g. python mep.py water 40).

Arguments: basename - file name without the extension;
                      this should be the same for the .gbw and .scfp.
           npoints  - number of grid points per side
                      (80 should be fine)
"""

#!/usr/bin/env python


def read_xyz(xyz):
    atoms = list()
    x = list()
    y = list()
    z = list()

    with open(xyz) as fp:
        # Skip the first two lines.
        next(fp)
        next(fp)
        for line in fp:
            data = line.split()
            atoms.append(data[0])
            x.append(float(data[1]))
            y.append(float(data[2]))
            z.append(float(data[3]))

    return atoms, np.array(x), np.array(y), np.array(z)


def read_vpot(vpot):
    v = list()

    with open(vpot) as fp:
        next(fp)
        for line in fp:
            data = line.split()
            v.append(float(data[3]))

    return np.array(v)

if __name__ == '__main__':
    import os
    import sys
    import subprocess
    import numpy as np

    ang_to_au = 1.0 / 0.5291772083

    elements = [None,
         'H', 'He',
         'Li', 'Be',
         'B', 'C', 'N', 'O', 'F', 'Ne',
         'Na', 'Mg',
         'Al', 'Si', 'P', 'S', 'Cl', 'Ar',
         'K', 'Ca',
         'Sc', 'Ti', 'V', 'Cr', 'Mn', 'Fe', 'Co', 'Ni', 'Cu', 'Zn',
         'Ga', 'Ge', 'As', 'Se', 'Br', 'Kr',
         'Rb', 'Sr',
         'Y', 'Zr', 'Nb', 'Mo', 'Tc', 'Ru', 'Rh', 'Pd', 'Ag', 'Cd',
         'In', 'Sn', 'Sb', 'Te', 'I', 'Xe',
         'Cs', 'Ba',
         'La', 'Ce', 'Pr', 'Nd', 'Pm', 'Sm', 'Eu', 'Gd', 'Tb', 'Dy', 'Ho', 'Er', 'Tm', 'Yb',
         'Lu', 'Hf', 'Ta', 'W', 'Re', 'Os', 'Ir', 'Pt', 'Au', 'Hg',
         'Tl', 'Pb', 'Bi', 'Po', 'At', 'Rn',
         'Fr', 'Ra',
         'Ac', 'Th', 'Pa', 'U', 'Np', 'Pu', 'Am', 'Cm', 'Bk', 'Cf', 'Es', 'Fm', 'Md', 'No',
         'Lr', 'Rf', 'Db', 'Sg', 'Bh', 'Hs', 'Mt', 'Ds', 'Rg', 'Uub']

    basename = sys.argv[1]
    xyz = basename + '.xyz'

    if not os.path.isfile(xyz):
        sys.exit('Could not find the .xyz. To quickly generate one for '
                 'your molecule run: echo 11 | orca_plot {}.gbw -i.'.format(basename))

    atoms, x, y, z = read_xyz(xyz)

    try:
        npoints = int(sys.argv[2])
    except ValueError:
        sys.exit('Invalid number of points: {}'.format(sys.argv[2]))

    natoms = len(atoms)

    extent = 7.0
    xmin = x.min() * ang_to_au - extent
    xmax = x.max() * ang_to_au + extent
    ymin = y.min() * ang_to_au - extent
    ymax = y.max() * ang_to_au + extent
    zmin = z.min() * ang_to_au - extent
    zmax = z.max() * ang_to_au + extent

    with open(basename + '_mep.inp', 'w') as fp:
        fp.write('{0:d}\n'.format(npoints**3))
        for ix in np.linspace(xmin, xmax, npoints, True):
            for iy in np.linspace(ymin, ymax, npoints, True):
                for iz in np.linspace(zmin, zmax, npoints, True):
                    fp.write('{0:12.6f} {1:12.6f} {2:12.6f}\n'.format(ix, iy, iz))

    subprocess.check_call(['orca_vpot', basename + '.gbw', basename + '.scfp',
            basename + '_mep.inp', basename + '_mep.out'])

    vpot = read_vpot(basename + '_mep.out')

    with open(basename + '_mep.cube', 'w') as fp:
        fp.write('Generated with ORCA\n')
        fp.write('Electrostatic potential for ' + basename + '\n')
        fp.write('{0:5d}{1:12.6f}{2:12.6f}{3:12.6f}\n'.format(
            len(atoms), xmin, ymin, zmin))
        fp.write('{0:5d}{1:12.6f}{2:12.6f}{3:12.6f}\n'.format(
            npoints, (xmax - xmin) / float(npoints - 1), 0.0, 0.0))
        fp.write('{0:5d}{1:12.6f}{2:12.6f}{3:12.6f}\n'.format(
            npoints, 0.0, (ymax - ymin) / float(npoints - 1), 0.0))
        fp.write('{0:5d}{1:12.6f}{2:12.6f}{3:12.6f}\n'.format(
            npoints, 0.0, 0.0, (zmax - zmin) / float(npoints - 1)))
        for i, atom in enumerate(atoms):
            index = elements.index(atom)
            fp.write('{0:5d}{1:12.6f}{2:12.6f}{3:12.6f}{4:12.6f}\n'.format(
                index, 0.0, x[i] * ang_to_au, y[i] * ang_to_au, z[i] * ang_to_au))

        m = 0
        n = 0
        vpot = np.reshape(vpot, (npoints, npoints, npoints))
        for ix in range(npoints):
            for iy in range(npoints):
                for iz in range(npoints):
                    fp.write('{0:14.5e}'.format(vpot[ix][iy][iz]))
                    m += 1
                    n += 1
                    if (n > 5):
                        fp.write('\n')
                        n = 0
                if n != 0:
                    fp.write('\n')
                    n = 0
The script can be run just using python mep.py basename npoints (like the example below):
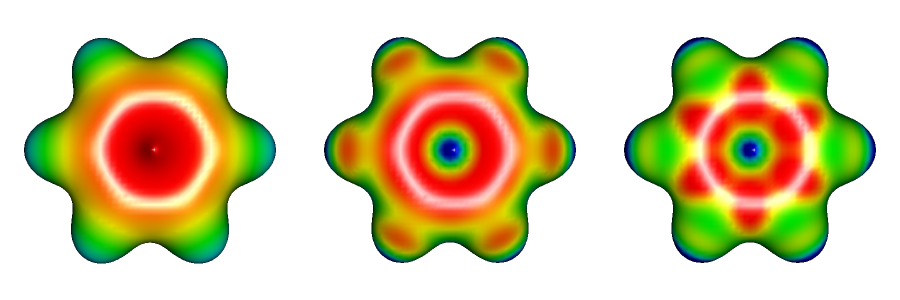
python mep.py water 100The script will use orca_vpot for you, (yes, you need to have ORCA installed) and do all the hard lifting, generating the potential surfaces in 2 files, a .cube and a .out. Looking at the .out file, the potentials that you can use to map against any surface is the 4th column. I’ve found that using the .out file is kind of difficult (at least for me) but the .cube works perfectly in conjunction with the electronic density.
Let me show you how to use UCSF Chimera to see the MEP generated by ORCA then.
I’m assuming that you already used the python script to get the potentials. Now you must use orca_plot to generate the electron density. For example, running:
orca_plot Water.gbw -iSelect, sequentially, options 1 (Enter type of plot), 2 ((scf) electron density), 4 (Enter number of grid intervals), 120, 5 (Select output file format), 7 (3D Gaussian cube), 10 (Plot), 11 (Exit). You will get something like Water.eldens.cube.
Now you can use Chimera to open the XYZ file and the electron density going to Tools à Volume Data à Volume Viewer à File à Open map… à Water.eldens.cube. Then go to Tools à Surface Color and select by “electrostatic potential”. In “Potential file” browse to Water_mep.cube that was generated by the python script. Choose your coloring scheme if you want by looking into “Options” and when you are done press “Color”. That is it!


One thought on “Plotting molecular electrostatic potential surfaces (MEPS) with ORCA”